Introduction
JavaScript, often described as the internet’s lingua franca, powers everything from dynamic web interfaces to robust server-side applications and even embedded devices. Its ubiquity makes it a cornerstone of modern software development. While developers frequently interact with JavaScript’s syntax and APIs, the intricate dance that transforms human-readable code into executable machine instructions remains a mystery to many.
Understanding the internal lifecycle of JavaScript code—how it’s parsed, compiled, and executed by engines like V8, SpiderMonkey, or JavaScriptCore—is not merely an academic exercise. It’s crucial for writing highly performant, robust, and maintainable applications. This deep dive will unravel the complex machinery beneath the surface, revealing the sophisticated techniques employed by modern JavaScript engines to deliver lightning-fast execution.
In this guide, you will learn the fundamental differences between JavaScript and traditionally compiled languages, trace the journey of your code from a plain text file to optimized machine code, explore the architecture of JavaScript engines, and delve into advanced concepts like Just-In-Time (JIT) compilation, garbage collection, and the event loop. By the end, you’ll possess a profound appreciation for the engineering marvels that make JavaScript tick.
The Problem It Solves
In the early days of the World Wide Web, web pages were largely static documents. The need for interactivity—dynamic content updates, form validations, animations, and user interface manipulations—quickly became apparent. Traditional server-side languages could generate dynamic HTML, but client-side interactivity required a language that could execute directly within the web browser.
This presented a significant challenge: how to provide a scripting language that was lightweight, easy to learn, safe for client-side execution, and, critically, compatible across various browsers and operating systems. Moreover, this language needed to be efficient enough to handle complex operations without bogging down the user experience, despite the limited resources of early client machines. The core problem JavaScript was designed to solve was to bring dynamic, programmable behavior directly to the web browser, enabling rich user experiences without constant server roundtrips.
JavaScript emerged as the solution, but its dynamic, untyped nature posed inherent performance challenges compared to statically typed, ahead-of-time compiled languages. The evolution of JavaScript engines has been a continuous effort to bridge this performance gap, transforming a flexible scripting language into a high-performance execution environment capable of handling demanding applications.
High-Level Architecture
JavaScript engines are complex systems designed to take JavaScript source code and execute it efficiently. While different engines (V8 by Google, SpiderMonkey by Mozilla, JavaScriptCore by Apple) have their unique implementations, their high-level architecture shares common stages. The overall process involves parsing, interpreting, and then progressively optimizing the code through Just-In-Time (JIT) compilation.
Here’s a simplified view of the JavaScript engine pipeline:
Component Overview:
- Lexer (Tokenizer): Breaks the source code into a stream of tokens (keywords, identifiers, operators, etc.).
- Parser: Takes the token stream and builds an Abstract Syntax Tree (AST), representing the grammatical structure of the code.
- Bytecode Generator: Converts the AST into a more compact, platform-independent bytecode format. This is faster to interpret than the raw AST.
- Interpreter: Executes the bytecode instruction by instruction. This provides quick startup but without peak performance.
- Profiler/Monitor: Observes the running code, identifying “hot” functions (those executed frequently) and gathering type feedback.
- JIT Compiler (Optimizing Compiler): Takes hot bytecode and type feedback, compiles it into highly optimized machine code specific to the underlying hardware.
- Deoptimizer: If the assumptions made by the JIT compiler (based on type feedback) are violated during execution, the engine “deoptimizes” the code, discarding the optimized machine code and reverting to bytecode interpretation.
- Heap: The region of memory where objects and variables are stored.
- Call Stack: Manages the execution context of functions, including local variables and return addresses.
- Event Loop: A crucial component for handling asynchronous operations, ensuring non-blocking execution in a single-threaded environment.
Data Flow:
- JavaScript source code enters the engine.
- The Lexer creates Tokens.
- The Parser uses these tokens to build an AST.
- The Bytecode Generator converts the AST into Bytecode.
- The Interpreter (e.g., V8’s Ignition) begins executing the bytecode.
- As code runs, a Profiler monitors execution, identifying “hot” functions (frequently called) and collecting type information.
- For hot functions, the JIT Compiler (e.g., V8’s TurboFan) takes the bytecode and type feedback, compiling it into highly Optimized Machine Code.
- This machine code is then executed directly by the CPU, offering peak performance.
- If runtime conditions change (e.g., a variable previously holding numbers suddenly holds a string), the JIT compiler’s assumptions are broken, triggering Deoptimization, and execution reverts to the bytecode interpreter.
- The Heap stores all objects and variables, managed by Garbage Collection.
- The Call Stack tracks function calls.
- The Event Loop orchestrates asynchronous tasks, pushing callbacks onto the Call Stack when it’s free.
How It Works: Step-by-Step Breakdown
The journey of JavaScript code from a .js file to an executing program is a multi-stage pipeline involving sophisticated transformations and optimizations.
Step 1: Source Code Input and Lexical Analysis (Tokenization)
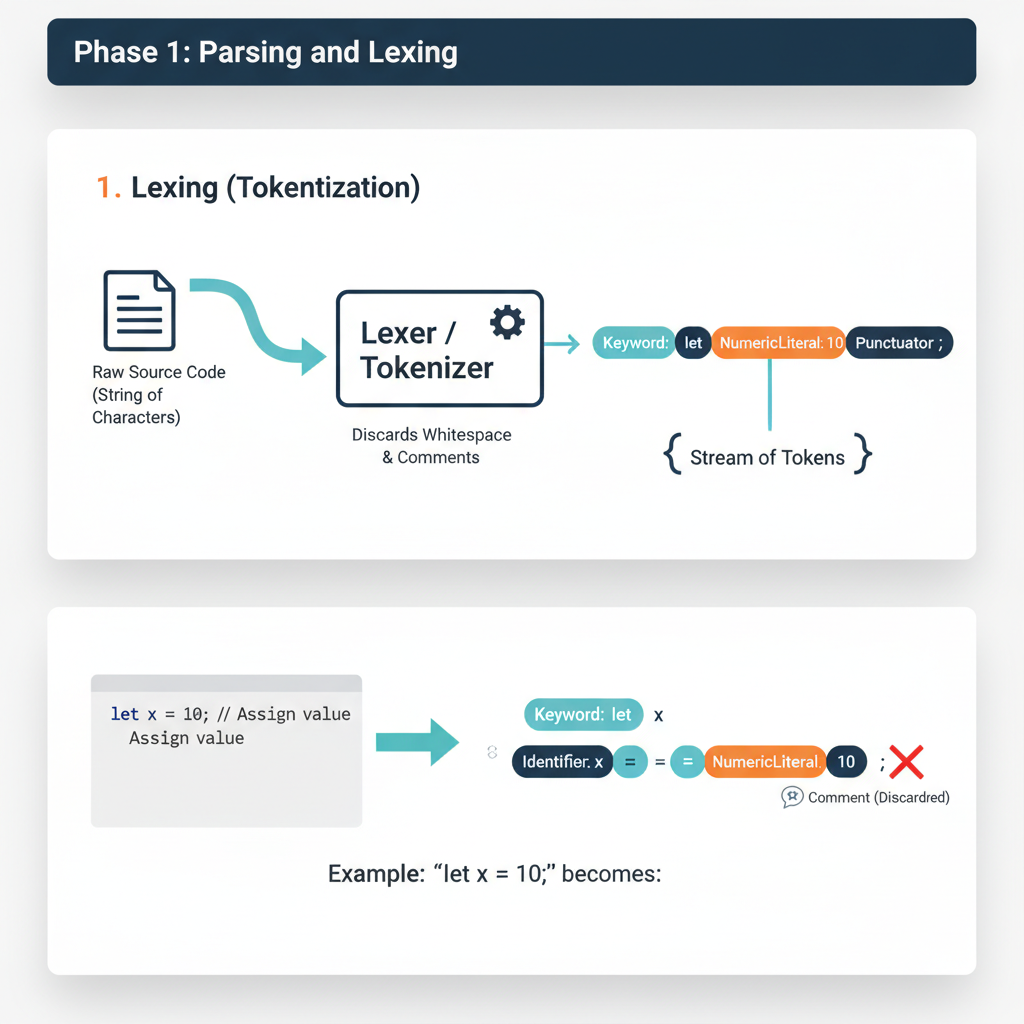
When a JavaScript file is loaded (e.g., by a browser, Node.js, or a web worker), the first step is to read the raw text and break it down into a meaningful sequence of tokens. This process is called lexical analysis or tokenization.
What happens internally: The Lexer (also known as a scanner) reads the source code character by character. It recognizes patterns that correspond to JavaScript’s grammar rules (keywords, identifiers, operators, literals, punctuation). It discards whitespace and comments. Each recognized unit is wrapped into a “token” object, which typically contains its type (e.g.,
KEYWORD,IDENTIFIER,OPERATOR,NUMBER), its value (e.g.,let,x,=,10), and its position in the source code.Code example showing this step:
Consider the following JavaScript snippet:
let count = 0;
function increment() {
    count = count + 1;
}
The lexer would produce a stream of tokens similar to this (simplified representation):
[
    { type: "KEYWORD", value: "let" },
    { type: "IDENTIFIER", value: "count" },
    { type: "OPERATOR", value: "=" },
    { type: "NUMBER", value: "0" },
    { type: "PUNCTUATOR", value: ";" },
    { type: "KEYWORD", value: "function" },
    { type: "IDENTIFIER", value: "increment" },
    { type: "PUNCTUATOR", value: "(" },
    { type: "PUNCTUATOR", value: ")" },
    { type: "PUNCTUATOR", value: "{" },
    { type: "IDENTIFIER", value: "count" },
    { type: "OPERATOR", value: "=" },
    { type: "IDENTIFIER", value: "count" },
    { type: "OPERATOR", value: "+" },
    { type: "NUMBER", value: "1" },
    { type: "PUNCTUATOR", value: ";" },
    { type: "PUNCTUATOR", value: "}" }
]
Step 2: Syntactic Analysis (Parsing) and AST Construction
The stream of tokens generated by the lexer is then fed into the Parser. The parser’s job is to determine if the sequence of tokens forms a valid JavaScript program according to the language’s grammar rules. If it’s valid, the parser constructs an Abstract Syntax Tree (AST).
What happens internally: The parser builds a tree structure where each node represents a construct in the source code (e.g., a variable declaration, a function call, an expression). The AST captures the hierarchical and grammatical relationships between the different parts of the code, but it doesn’t contain all the syntactic details (like parentheses or semicolons) that are important for parsing but not for execution. It’s an “abstract” representation.
Code example showing this step:
For the token stream from
let count = 0;, the AST might look something like this (simplified JSON representation):{ "type": "Program", "body": [ { "type": "VariableDeclaration", "kind": "let", "declarations": [ { "type": "VariableDeclarator", "id": { "type": "Identifier", "name": "count" }, "init": { "type": "Literal", "value": 0 } } ] }, { "type": "FunctionDeclaration", "id": { "type": "Identifier", "name": "increment" }, "params": [], "body": { "type": "BlockStatement", "body": [ { "type": "ExpressionStatement", "expression": { "type": "AssignmentExpression", "operator": "=", "left": { "type": "Identifier", "name": "count" }, "right": { "type": "BinaryExpression", "operator": "+", "left": { "type": "Identifier", "name": "count" }, "right": { "type": "Literal", "value": 1 } } } } ] } } ] }This AST clearly shows the structure: a program containing a variable declaration and a function declaration, with the function body containing an assignment expression composed of a binary addition.
Step 3: Scope Analysis and Variable Resolution
Once the AST is built, the engine performs a “walk” of the tree to analyze variable scopes and resolve identifiers. This phase is crucial for understanding which variable declaration an identifier refers to.
What happens internally: The engine determines the lexical environment for each scope (global, function, block). It identifies declarations (
var,let,const,function,class) and their associated scopes. This is where concepts like hoisting, closures, and the temporal dead zone forletandconstare established. For every identifier, the engine determines its binding (where it was declared) and whether it’s a local variable, a parameter, or a closure variable.Code example showing this step:
Consider the
incrementfunction again:let count = 0; // Global scope function increment() { // Function scope count = count + 1; // 'count' here refers to the global 'count' let local = 5; // 'local' is in function scope }During scope analysis, the engine would determine that
countinsideincrementis not declared locally, so it must refer to thecountin the parent (global) scope.localis identified as a new variable within theincrementfunction’s scope. This information is often added as annotations to the AST nodes or used to build symbol tables.
Step 4: Bytecode Generation
After the AST is constructed and semantically analyzed, it’s typically converted into bytecode. Bytecode is a low-level, platform-independent representation of the code that is more compact and efficient for interpreters to execute than directly traversing the AST.
What happens internally: A Bytecode Generator (e.g., V8’s
Ignitioncomponent includes this) traverses the AST and emits a sequence of bytecode instructions. Each instruction is a simple operation (e.g., load variable, add numbers, call function). This step is a form of compilation, but to an intermediate representation, not directly to machine code. The bytecode is also optimized for size and interpretability.Code example showing this step:
For
count = count + 1;, the bytecode might look something like this (simplified for V8’s Ignition):LdaGlobal "count" // Load the value of global variable 'count' into accumulator AddI 1 // Add integer 1 to the accumulator StaGlobal "count" // Store the accumulator value back into global variable 'count'This sequence is much more direct for an interpreter to process than navigating complex AST nodes.
Step 5: Interpretation
The generated bytecode is then executed by an Interpreter. This is the first execution phase, designed for quick startup and handling code that isn’t frequently run.
What happens internally: The Interpreter (e.g., V8’s Ignition, SpiderMonkey’s Baseline Interpreter) reads and executes the bytecode instructions one by one. It maintains the execution context, manages the call stack, and interacts with the heap for memory allocation. While relatively fast to start, interpretation is generally slower than executing native machine code because each bytecode instruction must be fetched, decoded, and then performed by the interpreter itself, rather than directly by the CPU.
Code example showing this step:
When
increment()is called, the interpreter executes the bytecode forcount = count + 1;:LdaGlobal "count": Interpreter looks upcountin the global scope, retrieves its value (e.g.,0), and puts it into an internal register (accumulator).AddI 1: Interpreter takes the accumulator’s value (0), adds1to it, resulting in1.StaGlobal "count": Interpreter updates the globalcountvariable with the new value (1). This process continues for all bytecode instructions.
Step 6: Just-In-Time (JIT) Compilation and Optimization
For code that is executed frequently (“hot code”), JavaScript engines employ Just-In-Time (JIT) compilers to translate bytecode into highly optimized machine code. This is where significant performance gains are achieved.
What happens internally: A Profiler continuously monitors the running code during interpretation. It identifies “hot functions” (e.g., functions called many times or loops that run for many iterations). When a function is deemed hot, the engine sends its bytecode, along with type feedback gathered during interpretation (e.g., “variable
xwas always a number in this loop”), to an Optimizing JIT Compiler (e.g., V8’s TurboFan, SpiderMonkey’s IonMonkey, JavaScriptCore’s FTL). This compiler performs advanced optimizations:- Type Specialization: If a variable consistently holds a specific type (e.g., always an integer), the JIT can generate machine code optimized for that type, avoiding costly runtime type checks.
- Inline Caching: Caches the lookup results for property access, making subsequent accesses much faster.
- Inlining: Replaces function calls with the actual body of the called function, reducing call overhead.
- Dead Code Elimination: Removes code that has no effect.
- Loop Optimizations: Restructures loops for better performance. The result is highly efficient machine code tailored for the specific CPU architecture.
Code example showing this step:
If
increment()is called thousands of times in a loop:let count = 0; function increment() { count = count + 1; } for (let i = 0; i < 1000000; i++) { increment(); // This becomes a 'hot' function }The profiler would detect
increment()as hot. The JIT compiler would then take its bytecode and compile it into native machine code. Sincecountconsistently holds numbers, the JIT can generate highly specialized instructions for integer addition and assignment, bypassing the interpreter’s overhead.
Step 7: Optimized Machine Code Execution
Once compiled by the JIT, the optimized machine code is executed directly by the CPU. This provides the fastest possible execution speed for JavaScript.
- What happens internally: The engine replaces the bytecode pointer for the hot function with a pointer to the newly compiled machine code. Subsequent calls to that function will directly execute the native machine instructions. This is where JavaScript achieves performance comparable to or sometimes even exceeding traditionally compiled languages for certain workloads.
- Deoptimization: A critical aspect of JIT is deoptimization. The JIT compiler makes assumptions based on observed types. If, at any point, these assumptions are violated (e.g.,
countsuddenly becomes a string,count = "hello" + 1;), the optimized machine code becomes invalid. The engine detects this, discards the optimized code, and reverts execution for that function back to the bytecode interpreter. This ensures correctness at the cost of a temporary performance hit.
Step 8: Garbage Collection and Memory Management
Throughout the execution lifecycle, the JavaScript engine continuously manages memory, specifically the Heap where objects and variables reside. This is handled by an automatic Garbage Collector (GC).
What happens internally: JavaScript uses a tracing garbage collector, primarily the Mark-and-Sweep algorithm, often with Generational Collection.
- Mark Phase: The GC starts from “root” objects (e.g., global variables, objects on the call stack) and traverses all reachable objects, marking them as “in use.”
- Sweep Phase: All objects not marked as “in use” are considered garbage and their memory is reclaimed.
- Generational Collection: Most GCs divide the heap into “generations” (e.g., Young Generation for new objects, Old Generation for long-lived objects). New objects are likely to die quickly, so the Young Generation is collected more frequently and efficiently (e.g., using a Scavenger algorithm like Cheney’s). Objects that survive multiple Young Generation collections are promoted to the Old Generation, which is collected less frequently with more thorough algorithms. This significantly reduces GC pause times.
Code example showing this step:
function createObject() {
    let obj = { a: 1, b: "hello" }; // obj is created on the heap
    return obj; // obj is returned, still reachable
}

let myObj = createObject(); // myObj holds a reference to the object

function anotherFunction() {
    let tempObj = { x: 10 }; // tempObj created, likely short-lived
    // ...
}
anotherFunction(); // tempObj goes out of scope, becomes eligible for GC
// myObj remains reachable, will not be collected until its reference is removed
myObj = null; // Now the object previously referenced by myObj is eligible for GC
The GC will periodically run, identifying objects like
tempObjafteranotherFunctioncompletes, and the object previously referenced bymyObjoncemyObjis set tonull, reclaiming their memory.
Deep Dive: Internal Mechanisms
Modern JavaScript engines are marvels of engineering, employing sophisticated algorithms and data structures to deliver high performance. Let’s explore some key internal mechanisms in more detail, often using V8 (Google Chrome’s and Node.js’s engine) as a primary example due to its extensive public documentation.
Mechanism 1: JIT Compilation Pipeline (V8 Example)
V8’s JIT compilation pipeline is a multi-tiered system designed to balance fast startup with peak performance. It primarily consists of two compilers: Ignition (the interpreter and baseline compiler) and TurboFan (the optimizing compiler).
Ignition (Interpreter and Baseline Compiler):
- Role: Ignition is V8’s default execution engine. It processes bytecode generated from the AST. Its primary goals are fast startup and minimal memory footprint.
- Bytecode: V8’s bytecode is a compact, platform-independent instruction set. It’s designed to be efficient for interpretation and also serves as the input for TurboFan.
- Baseline Compilation: Ignition can also perform a form of “baseline compilation” for frequently run functions. This is a quick, minimal compilation to machine code without heavy optimizations, faster than interpretation but not as optimized as TurboFan. It acts as an intermediate step to bridge the gap between interpretation and full optimization.
- Type Feedback: As Ignition executes bytecode, it collects “type feedback.” This involves observing the actual types of values flowing through operations (e.g., “this
addoperation always saw two integers”). This feedback is crucial for TurboFan’s optimizations.
TurboFan (Optimizing Compiler):
- Role: TurboFan is V8’s highly optimizing JIT compiler. It takes bytecode and type feedback from Ignition and generates highly optimized machine code.
- Optimization Process:
- Sea of Nodes: TurboFan represents the code in an intermediate representation called “Sea of Nodes,” which is a graph where nodes are operations and edges represent data flow and control flow. This representation allows for powerful, global optimizations.
- Hidden Classes (Shapes/Maps): JavaScript objects are dynamic, but V8 uses “hidden classes” (also called “shapes” or “maps”) to optimize property access. When an object is created, it gets an initial hidden class. If properties are added or removed, a new hidden class is generated, linking back to the previous one. This allows the JIT to know the memory offset of properties without a dictionary lookup, similar to fixed-layout objects in static languages.
- Inline Caching (IC): When accessing a property (e.g.,
obj.x), the engine records the hidden class ofobjand the memory offset ofx. Ifobjlater has the same hidden class, the engine can directly accessxat the cached offset, bypassing a full lookup. Ifobjhas a different hidden class, the cache misses, a new entry is added, or the code is deoptimized if the property access pattern becomes too polymorphic. - Speculative Optimization: TurboFan makes assumptions based on type feedback (e.g., “this variable is always a number”). It generates machine code optimized for these assumptions.
- Deoptimization: If a speculative assumption proves false at runtime (e.g., a variable previously always a number suddenly receives a string), the optimized machine code is “deoptimized.” Execution reverts to Ignition’s bytecode, which is more robust to type changes. This is a critical safety net.
Mechanism 2: Event Loop and Concurrency Model
JavaScript is inherently single-threaded, meaning it can only execute one piece of code at a time. However, it handles asynchronous operations (like network requests, timers, user interactions) in a non-blocking way through the Event Loop.
- Key Components:
- Call Stack: A LIFO (Last In, First Out) stack that stores function calls. When a function is called, it’s pushed onto the stack. When it returns, it’s popped off.
- Heap: Where objects are allocated in memory.
- Web APIs (Browser) / C++ APIs (Node.js): Provided by the environment (not the JS engine itself) to handle asynchronous tasks like
setTimeout,fetch, DOM events. - Callback Queue (Task Queue / Macrotask Queue): Stores callback functions from Web APIs (e.g.,
setTimeoutcallbacks, DOM event handlers) once their asynchronous operations complete. - Microtask Queue: A higher-priority queue for callbacks from Promises (
.then,.catch,.finally) andqueueMicrotask. - Event Loop: The central orchestrator. It continuously monitors the Call Stack and the various queues.
- How it Works:
- When the Call Stack is empty, the Event Loop checks the Microtask Queue. If there are microtasks, it moves them to the Call Stack to be executed until the Microtask Queue is empty.
- After clearing the Microtask Queue, the Event Loop checks the Callback Queue (Macrotask Queue). If there are macrotasks, it moves one macrotask at a time to the Call Stack for execution.
- This cycle repeats indefinitely.
- Performance Implications: Understanding the Event Loop is vital for preventing “blocking” the main thread, which leads to unresponsive UIs. Operations that take a long time should be asynchronous or offloaded to Web Workers.
Mechanism 3: Memory Management (Garbage Collection)
JavaScript’s automatic memory management relieves developers from manual allocation and deallocation. The engine’s Garbage Collector (GC) identifies and reclaims memory occupied by objects that are no longer reachable.
- Generational Garbage Collection (V8’s
Orinoco):- Observation: Most objects are either very short-lived (e.g., temporary variables in a function) or very long-lived (e.g., global objects).
- Generations: The heap is typically divided into two main generations:
- Young Generation (Nursery/New Space): Stores newly allocated objects. It’s small and collected frequently using a fast algorithm (e.g., Scavenger). The Scavenger (based on Cheney’s algorithm) copies live objects from one semi-space to another, effectively compacting memory and reclaiming dead objects quickly. Objects that survive a few Scavenger cycles are “promoted” to the Old Generation.
- Old Generation (Old Space): Stores objects that have survived multiple Young Generation collections. It’s larger and collected less frequently using a more robust algorithm (e.g., Mark-Sweep-Compact).
- Mark-Sweep-Compact:
- Mark: The GC traverses the object graph starting from roots, marking all reachable objects.
- Sweep: It iterates through the heap, reclaiming memory from unmarked (dead) objects.
- Compact: To prevent memory fragmentation, the GC moves live objects together, making contiguous free blocks available for new allocations. This is an expensive operation, often paused or incremental.
- Memory Leaks: While automatic, memory leaks can still occur if objects are inadvertently kept reachable (e.g., through forgotten event listeners, global variables, or closures that retain large scopes). Modern GCs are highly optimized to minimize “stop-the-world” pauses, often using incremental and concurrent techniques to perform GC work in small chunks or on separate threads.
Hands-On Example: Building a Mini Version
To illustrate the fundamental concepts of tokenization, AST construction, and basic interpretation, let’s build a very simplified JavaScript-like expression evaluator. This “mini-engine” will only handle simple arithmetic expressions with numbers and the + operator.
// --- Step 1: Lexical Analysis (Tokenizer) ---
const TokenType = {
    NUMBER: 'NUMBER',
    PLUS: 'PLUS',
    EOF: 'EOF' // End Of File
};

class Token {
    constructor(type, value) {
        this.type = type;
        this.value = value;
    }
}

class Lexer {
    constructor(input) {
        this.input = input;
        this.position = 0;
        this.currentChar = this.input[this.position];
    }

    advance() {
        this.position++;
        this.currentChar = this.input[this.position];
    }

    skipWhitespace() {
        while (this.currentChar !== undefined && /\s/.test(this.currentChar)) {
            this.advance();
        }
    }

    number() {
        let result = '';
        while (this.currentChar !== undefined && /\d/.test(this.currentChar)) {
            result += this.currentChar;
            this.advance();
        }
        return new Token(TokenType.NUMBER, parseInt(result, 10));
    }

    getNextToken() {
        while (this.currentChar !== undefined) {
            if (/\s/.test(this.currentChar)) {
                this.skipWhitespace();
                continue;
            }

            if (/\d/.test(this.currentChar)) {
                return this.number();
            }

            if (this.currentChar === '+') {
                this.advance();
                return new Token(TokenType.PLUS, '+');
            }

            throw new Error(`Lexer Error: Unexpected character '${this.currentChar}'`);
        }
        return new Token(TokenType.EOF, null);
    }
}

// --- Step 2: Syntactic Analysis (Parser) and AST Construction ---
// AST Node types
const ASTNodeType = {
    PROGRAM: 'Program',
    BINARY_EXPRESSION: 'BinaryExpression',
    NUMBER_LITERAL: 'NumberLiteral'
};

class ASTNode {
    constructor(type, children = {}) {
        this.type = type;
        Object.assign(this, children);
    }
}

class Parser {
    constructor(lexer) {
        this.lexer = lexer;
        this.currentToken = this.lexer.getNextToken();
    }

    eat(tokenType) {
        if (this.currentToken.type === tokenType) {
            this.currentToken = this.lexer.getNextToken();
        } else {
            throw new Error(`Parser Error: Expected ${tokenType}, got ${this.currentToken.type}`);
        }
    }

    // Grammar:
    // program: expr EOF
    // expr: term (PLUS term)*
    // term: NUMBER

    numberLiteral() {
        const token = this.currentToken;
        this.eat(TokenType.NUMBER);
        return new ASTNode(ASTNodeType.NUMBER_LITERAL, { value: token.value });
    }

    term() {
        return this.numberLiteral();
    }

    expr() {
        let node = this.term(); // First term

        while (this.currentToken.type === TokenType.PLUS) {
            const operator = this.currentToken.value;
            this.eat(TokenType.PLUS);
            node = new ASTNode(ASTNodeType.BINARY_EXPRESSION, {
                operator: operator,
                left: node,
                right: this.term()
            });
        }
        return node;
    }

    parse() {
        const programNode = new ASTNode(ASTNodeType.PROGRAM, { body: this.expr() });
        this.eat(TokenType.EOF);
        return programNode;
    }
}

// --- Step 3: Interpreter (Evaluator) ---
class Interpreter {
    constructor(ast) {
        this.ast = ast;
    }

    visit(node) {
        switch (node.type) {
            case ASTNodeType.PROGRAM:
                return this.visit(node.body);
            case ASTNodeType.NUMBER_LITERAL:
                return node.value;
            case ASTNodeType.BINARY_EXPRESSION:
                return this.evaluateBinaryExpression(node);
            default:
                throw new Error(`Interpreter Error: Unknown AST node type ${node.type}`);
        }
    }

    evaluateBinaryExpression(node) {
        const left = this.visit(node.left);
        const right = this.visit(node.right);

        switch (node.operator) {
            case '+':
                return left + right;
            default:
                throw new Error(`Interpreter Error: Unknown operator ${node.operator}`);
        }
    }

    interpret() {
        return this.visit(this.ast);
    }
}

// --- Main Execution ---
function executeMiniJS(code) {
    console.log(`Executing: "${code}"`);

    // 1. Lexical Analysis
    const lexer = new Lexer(code);
    let tokens = [];
    let token = lexer.getNextToken();
    while (token.type !== TokenType.EOF) {
        tokens.push(token);
        token = lexer.getNextToken();
    }
    tokens.push(token); // Add EOF token
    console.log("Tokens:", tokens.map(t => `${t.type}:${t.value === null ? 'EOF' : t.value}`).join(', '));

    // Reset lexer for parser
    const parserLexer = new Lexer(code);

    // 2. Syntactic Analysis and AST Construction
    const parser = new Parser(parserLexer);
    const ast = parser.parse();
    console.log("AST:", JSON.stringify(ast, null, 2));

    // 3. Interpretation
    const interpreter = new Interpreter(ast);
    const result = interpreter.interpret();
    console.log("Result:", result);
    console.log("---");
    return result;
}

// Test cases
executeMiniJS("10");
executeMiniJS("5 + 3");
executeMiniJS("1 + 2 + 3");
executeMiniJS("10 + 20 + 5");
// executeMiniJS("10 * 5"); // Will throw an error because '*' is not supported
Walk through the code line by line:
TokenTypeandTokenclasses: Define the types of tokens our lexer will recognize (NUMBER, PLUS, EOF) and a simpleTokenclass to hold the type and value.Lexerclass:constructor: Initializes with the input string and current position.advance(): Moves to the next character.skipWhitespace(): Ignores spaces.number(): Reads a sequence of digits and creates aNUMBERtoken.getNextToken(): This is the core of the lexer. It repeatedly checks thecurrentCharto see if it matches a number,+operator, or whitespace. If it finds a match, it creates and returns the correspondingToken. If it reaches the end, it returnsEOF.
ASTNodeTypeandASTNodeclasses: Define the types of nodes in our AST (PROGRAM, BINARY_EXPRESSION, NUMBER_LITERAL) and a genericASTNodeclass.Parserclass:constructor: Takes aLexerinstance and gets the first token.eat(tokenType): Consumes the current token if it matches the expected type, then advances to the next token. This is fundamental for parsing.numberLiteral(): Parses aNUMBERtoken and creates aNumberLiteralAST node.term(): In our simple grammar, atermis just anumberLiteral.expr(): This is where the(PLUS term)*rule is handled. It parses the firstterm, then loops, consumingPLUSoperators and subsequentterms, building aBinaryExpressionAST node for each+operation, nesting them correctly.parse(): The entry point for parsing, which expects anexprfollowed byEOF. It returns the rootProgramAST node.
Interpreterclass:constructor: Takes the generated AST.visit(node): A recursive method that acts as the AST traversal. It dispatches to specific evaluation methods based on thenode.type.evaluateBinaryExpression(node): Recursively visits theleftandrightchildren of aBinaryExpressionnode, then performs the specified operation (in this case,+).interpret(): Starts the interpretation process by visiting the rootProgramnode.
executeMiniJS(code)function:- Orchestrates the entire process:
- Creates a
Lexerand tokenizes the input, printing the tokens. - Creates a
Parser(with a freshLexerinstance to restart token stream) and builds the AST, printing it. - Creates an
Interpreterand runs the interpretation, printing the final result.
- Creates a
- Orchestrates the entire process:
This mini-engine demonstrates how source code is first broken down, then structured into a tree, and finally walked to produce a result, mimicking the initial stages of a real JavaScript engine.
Real-World Project Example
Consider a common scenario in web development: rendering a list of items. If not handled carefully, especially when dealing with large lists or frequent updates, this can lead to performance bottlenecks. Understanding JavaScript engine internals, particularly JIT compilation and the Event Loop, allows us to optimize such situations.
Problem: A React component renders a list of 10,000 items. Each item has a calculateValue method that performs a simple arithmetic operation. If this method’s implementation causes JIT deoptimization, the rendering performance will suffer.
Initial (Potentially Suboptimal) Code:
// src/components/ItemList.jsx
import React, { useState, useEffect } from 'react';

// Imagine this is a complex object coming from an API
class Item {
    constructor(id, baseValue) {
        this.id = id;
        this.baseValue = baseValue;
    }

    // This method could cause deoptimization if 'multiplier' changes type
    calculateValue(multiplier) {
        // If multiplier is sometimes a number, sometimes a string,
        // the JIT compiler will deoptimize this function.
        // For example, if multiplier is '2' (string) instead of 2 (number)
        return this.baseValue * multiplier;
    }
}

const ItemList = () => {
    const [items, setItems] = useState([]);
    const [currentMultiplier, setCurrentMultiplier] = useState(2);

    useEffect(() => {
        // Simulate fetching 10,000 items
        const fetchedItems = Array.from({ length: 10000 }, (_, i) =>
            new Item(i, Math.random() * 100)
        );
        setItems(fetchedItems);

        // Simulate multiplier changing occasionally to a string
        const interval = setInterval(() => {
            setCurrentMultiplier(prev => {
                const next = prev === 2 ? '3' : 2; // Introduce type change for multiplier
                console.log(`Changing multiplier to: ${next} (type: ${typeof next})`);
                return next;
            });
        }, 5000); // Every 5 seconds

        return () => clearInterval(interval);
    }, []);

    return (
        <div>
            <h1>Item List ({items.length} items)</h1>
            <button onClick={() => setCurrentMultiplier(prev => (prev === 2 ? 4 : 2))}>
                Toggle Multiplier (Number)
            </button>
            <p>Current Multiplier: {currentMultiplier} (Type: {typeof currentMultiplier})</p>
            <ul>
                {items.map(item => (
                    <li key={item.id}>
                        Item {item.id}: Base {item.baseValue.toFixed(2)}, Calculated {item.calculateValue(currentMultiplier).toFixed(2)}
                    </li>
                ))}
            </ul>
        </div>
    );
};

export default ItemList;
Setup and How to Run:
- Create a React project:
npx create-react-app js-engine-example cd js-engine-example - Replace
src/App.jswith theItemList.jsxcontent:// src/App.js import ItemList from './components/ItemList'; function App() { return ( <div className="App"> <ItemList /> </div> ); } export default App; - Create
src/components/ItemList.jsxand paste the code above. - Start the development server:
npm start - Open Chrome DevTools (or similar) -> Performance tab.
- Record a performance profile while the page is rendering and the multiplier is changing.
What to Observe:
- Initially, the rendering might be fast.
- When the
currentMultiplierswitches between2(number) and'3'(string), you’ll likely see a noticeable “jank” or slowdown in the UI. - In the DevTools performance profile, you might see “Optimize” and “Deoptimize” events in the V8 section. Specifically, the
calculateValuefunction might be repeatedly deoptimized and re-optimized. This is because the JIT compiler makes assumptions (e.g.,multiplieris always a number) and when that assumption is violated, it has to throw away the optimized machine code and revert to slower bytecode interpretation, then re-optimize.
Optimized Code (Avoiding Type Changes):
// src/components/ItemList.jsx - Optimized version
import React, { useState, useEffect, useMemo } from 'react';

class Item {
    constructor(id, baseValue) {
        this.id = id;
        this.baseValue = baseValue;
    }

    // Ensure 'multiplier' is always a number
    calculateValue(multiplier) {
        // Explicitly convert to number to ensure consistent type
        const numericMultiplier = Number(multiplier);
        return this.baseValue * numericMultiplier;
    }
}

const ItemList = () => {
    const [items, setItems] = useState([]);
    const [currentMultiplier, setCurrentMultiplier] = useState(2);

    useEffect(() => {
        const fetchedItems = Array.from({ length: 10000 }, (_, i) =>
            new Item(i, Math.random() * 100)
        );
        setItems(fetchedItems);

        // Still simulate type change for demonstration, but our calculateValue handles it
        const interval = setInterval(() => {
            setCurrentMultiplier(prev => {
                const next = prev === 2 ? '3' : 2; // Multiplier sometimes string, sometimes number
                console.log(`Changing multiplier to: ${next} (type: ${typeof next})`);
                return next;
            });
        }, 5000);

        return () => clearInterval(interval);
    }, []);

    // Memoize the rendered items to avoid re-calculating if multiplier changes but items don't
    const renderedItems = useMemo(() => {
        return items.map(item => (
            <li key={item.id}>
                Item {item.id}: Base {item.baseValue.toFixed(2)}, Calculated {item.calculateValue(currentMultiplier).toFixed(2)}
            </li>
        ));
    }, [items, currentMultiplier]); // Recalculate only if items or multiplier change

    return (
        <div>
            <h1>Item List ({items.length} items)</h1>
            <button onClick={() => setCurrentMultiplier(prev => (prev === 2 ? 4 : 2))}>
                Toggle Multiplier (Number)
            </button>
            <p>Current Multiplier: {currentMultiplier} (Type: {typeof currentMultiplier})</p>
            <ul>
                {renderedItems}
            </ul>
        </div>
    );
};

export default ItemList;
What to Observe with Optimized Code:
- Even when
currentMultiplierchanges type (from number to string), thecalculateValuefunction will consistently receive anumberafterNumber(multiplier)conversion. - This ensures that the
calculateValuefunction remains “monomorphic” regarding itsmultiplierparameter’s type. - In the DevTools performance profile, you should see far fewer (or no) deoptimization events for
calculateValue. The engine can keep the optimized machine code for this function, leading to smoother, more consistent performance even with type changes in the input before the function. - The
useMemohook further optimizes by preventing re-rendering the list items ifitemsorcurrentMultiplierhaven’t changed, reducing the overall work for React and the engine.
This example highlights how a deep understanding of JIT compilation and type specialization can directly lead to writing more performant JavaScript code. By ensuring consistent types for function arguments and object properties, developers can help the JIT compiler generate and maintain highly optimized machine code, avoiding costly deoptimizations.
Performance & Optimization
JavaScript engines are continuously optimized, but developers can also write code that cooperates with these optimizations.
How it’s optimized
- Just-In-Time (JIT) Compilation: As detailed, the core of modern JS performance is JIT, which compiles hot bytecode to optimized machine code.
- Inline Caching (IC): Speeds up property access and method calls by caching the results of previous lookups based on the “shape” (hidden class) of objects. If an object has the same shape as a previously seen object, the property can be accessed directly without a dictionary lookup.
- Hidden Classes (Shapes/Maps): Allows engines to treat JavaScript objects, which are dynamically typed, more like fixed-layout objects found in static languages. This enables efficient memory layouts and faster property access.
- Type Specialization: If a function consistently receives arguments of the same type, the JIT compiler can generate machine code specifically for that type, avoiding generic operations that handle multiple types.
- Garbage Collection (GC) Optimizations: Modern GCs use generational collection, incremental collection, and concurrent collection to minimize “stop-the-world” pauses, ensuring a smoother user experience.
- Dead Code Elimination: The JIT compiler can identify and remove code paths that are never reached, reducing the size of the generated machine code.
- Inlining: Small, frequently called functions can have their code inserted directly into the caller’s code, eliminating the overhead of a function call.
Trade-offs made
- Startup Time vs. Peak Performance: JIT compilation has an overhead. The initial interpretation phase is fast for startup, but the JIT compiler takes time and memory to profile, compile, and optimize. This means small scripts might run faster if only interpreted, while long-running applications benefit immensely from JIT.
- Memory Usage: Storing bytecode, ASTs, type feedback, and multiple versions of machine code (interpreted, baseline, optimized) consumes more memory than just storing interpreted code.
- Complexity: The JIT pipeline is incredibly complex, making engine development and debugging challenging.
- Deoptimization Cost: While essential for correctness, deoptimization comes with a performance penalty as the engine reverts to slower interpreted code and potentially re-optimizes later.
Benchmarks (Conceptual)
While exact benchmarks vary wildly by engine, hardware, and specific workload, the impact of JIT optimizations can be dramatic. For CPU-bound tasks like heavy computations, array manipulations, or string processing, optimized JavaScript can achieve performance within 2-5x of C/C++ native code, whereas purely interpreted JavaScript might be 10-100x slower. The key is consistent type usage and avoiding patterns that trigger deoptimization.
Common Misconceptions
- “JavaScript is purely interpreted.”
- Clarification: This was largely true in the very early days, but modern JavaScript engines are primarily Just-In-Time (JIT) compiled. Code is first interpreted (for fast startup), and “hot” code paths are then compiled to highly optimized machine code. It’s a hybrid approach, not purely interpreted.
- “JavaScript is single-threaded, so it can’t perform parallel tasks.”
- Clarification: The JavaScript execution engine is single-threaded, meaning only one piece of JavaScript code runs at a time on the main thread. However, the environment (browser or Node.js) provides APIs (Web APIs like
setTimeout,fetch,Web Workers) that operate asynchronously, often leveraging underlying operating system threads. The Event Loop then orchestrates these asynchronous results back to the main thread, giving the appearance of concurrency without true parallel execution of JavaScript code on a single core. Web Workers allow true parallel execution of JavaScript in separate threads, but they communicate via message passing, not shared memory.
- Clarification: The JavaScript execution engine is single-threaded, meaning only one piece of JavaScript code runs at a time on the main thread. However, the environment (browser or Node.js) provides APIs (Web APIs like
- “Garbage collection is always slow and causes significant pauses.”
- Clarification: While GC does involve pauses, modern JavaScript engines employ highly sophisticated, incremental, and generational garbage collectors (like V8’s Orinoco, SpiderMonkey’s generational GC). These GCs perform most of their work concurrently or incrementally in small chunks, significantly reducing “stop-the-world” pauses to milliseconds or less, making them largely imperceptible in many applications.
- “Using
varis always slower thanletorconst.”- Clarification: Performance differences are usually negligible and rarely a primary concern. The main distinction lies in scoping rules (
varis function-scoped,let/constare block-scoped) and mutability (constprevents re-assignment).letandconsthave a “temporal dead zone” which requires more checks during parsing/execution, but engines are highly optimized for this. The choice should be based on semantic correctness and code clarity, not micro-optimizations.
- Clarification: Performance differences are usually negligible and rarely a primary concern. The main distinction lies in scoping rules (
- “Empty loops are optimized away by the engine.”
- Clarification: While JIT compilers are smart, an empty loop that doesn’t affect observable program state might be optimized away. However, relying on this is risky. A loop that simply counts up to a large number (e.g.,
for (let i = 0; i < 1e9; i++) {}) will still consume CPU cycles, as the engine can’t always guarantee it has no side effects (e.g., ifiwere a global variable). It’s better to avoid unnecessary computation altogether.
- Clarification: While JIT compilers are smart, an empty loop that doesn’t affect observable program state might be optimized away. However, relying on this is risky. A loop that simply counts up to a large number (e.g.,
Advanced Topics
- WebAssembly (Wasm) Integration:
- Concept: WebAssembly is a low-level binary instruction format designed as a portable compilation target for high-level languages like C, C++, Rust, and Go. It runs alongside JavaScript in the same execution environment (browser, Node.js).
- Engine Role: JavaScript engines (like V8) include a WebAssembly runtime. They compile
.wasmmodules to native machine code very quickly (often faster than JIT compiling JavaScript) and execute them. - Interaction: JavaScript can call Wasm functions and vice-versa, allowing performance-critical parts of an application to be written in Wasm while JavaScript handles the dynamic parts and DOM manipulation. This integration is a major step towards near-native performance on the web.
ArrayBufferand Typed Arrays:- Concept:
ArrayBufferobjects represent a generic, fixed-length raw binary data buffer. Typed Arrays (e.g.,Uint8Array,Float32Array) provide views into anArrayBuffer, allowing JavaScript to manipulate raw byte data directly. - Engine Role: These features allow JavaScript to interact with memory at a lower level, which is crucial for high-performance applications like image processing, audio manipulation, WebGL, and WebAssembly integration. The engine provides efficient, optimized access to these raw memory blocks, often bypassing typical JavaScript object overhead.
- Concept:
- Engine-Specific Flags and APIs (V8 Example):
- V8 Flags: V8 provides numerous command-line flags (e.g.,
--trace-opt,--trace-deopt,--print-bytecode,--print-code) that allow developers to inspect the internal workings of the JIT compiler.--trace-opt: Logs when functions are optimized by TurboFan.--trace-deopt: Logs when optimized code is deoptimized and why.--print-bytecode: Prints the bytecode generated for functions.--print-code: Prints the final machine code generated by TurboFan.
- Internal APIs: While not for general use, engines expose internal APIs (e.g.,
v8.getHeapStatistics()in Node.js) for monitoring and debugging, providing insights into heap usage, GC activity, and other runtime metrics. These are invaluable for profiling and identifying performance bottlenecks or memory leaks.
- V8 Flags: V8 provides numerous command-line flags (e.g.,
Comparison with Alternatives
Understanding JavaScript’s compilation and execution model is clearer when compared to other language paradigms:
Traditionally Compiled Languages (e.g., C++, Rust, Go):
- Compilation: These languages are Ahead-of-Time (AOT) compiled. Source code is fully compiled into machine code before execution by a separate compiler (e.g., GCC, Clang).
- Execution: The resulting executable contains only machine code and runs directly on the CPU.
- Typing: Typically statically typed, allowing the compiler to perform extensive type checks and optimizations during compilation.
- Performance: Generally achieve peak performance due to extensive AOT optimization and direct hardware access.
- Trade-offs: Slower compilation phase, less dynamic, often require manual memory management.
Interpreted Languages (e.g., Python, Ruby, early JavaScript):
- Compilation: Often no explicit compilation step to machine code. Source code is either directly interpreted line-by-line or compiled into a simpler bytecode that is then interpreted.
- Execution: An interpreter reads and executes the code/bytecode.
- Typing: Dynamically typed.
- Performance: Generally slower than compiled languages due to the overhead of interpretation and lack of deep optimization.
- Trade-offs: Faster development cycles, greater flexibility, but can struggle with CPU-intensive tasks.
Hybrid Compiled/Interpreted (e.g., Java, C#, modern JavaScript):
- Compilation: Source code is first compiled to an intermediate bytecode (Java Bytecode, CIL, JavaScript Bytecode).
- Execution: This bytecode is then executed by a Virtual Machine (JVM, CLR, JS Engine). The VM starts with interpretation, but for “hot” code, it employs a Just-In-Time (JIT) compiler to compile bytecode into optimized machine code during runtime.
- Typing: Java/C# are statically typed (at bytecode level), JavaScript is dynamically typed.
- Performance: Offers a balance, with fast startup (interpretation) and high peak performance (JIT compilation).
- Trade-offs: Memory overhead for the VM and multiple code versions, potential for “warm-up” time before peak performance is reached.
WebAssembly (Wasm):
- Compilation: Wasm is a low-level binary instruction format, meaning it’s already a compilation target for other languages. It’s designed for extremely fast parsing and compilation into machine code.
- Execution: Executed by a WebAssembly runtime within the JavaScript engine.
- Typing: Statically typed at its low level.
- Performance: Aims for near-native performance, often outperforming JIT-compiled JavaScript for CPU-bound tasks due to its simpler, more predictable nature and lack of dynamic type changes.
- Trade-offs: Not designed for direct human authoring, limited direct DOM access (relies on JavaScript for that), larger file sizes than text-based JS for equivalent logic.
JavaScript’s evolution to a JIT-compiled language with sophisticated engines like V8 has transformed it from a purely interpreted scripting language into a high-performance runtime environment, blending the flexibility of dynamic typing with the speed traditionally associated with compiled languages.
Debugging & Inspection Tools
Understanding the internal workings of JavaScript engines is invaluable when debugging performance issues or complex runtime behavior. Modern development tools offer deep insights into these internals.
Browser Developer Tools (Chrome DevTools, Firefox Developer Tools, Safari Web Inspector):
- Performance Tab: The most critical tool for understanding execution. It allows you to record a timeline of your application’s activity, showing:
- CPU usage: Identify long-running JavaScript tasks.
- Call Stack: See which functions are being called and how long they take.
- V8/JavaScript Engine events: Crucially, you can often see “Optimize” and “Deoptimize” events, indicating when the JIT compiler kicks in or when its assumptions are broken. This helps pinpoint code that’s causing performance regressions.
- Memory usage: Track heap allocations and garbage collection cycles.
- Event Loop activity: Visualize task queues and microtask queues.
- Memory Tab:
- Heap Snapshots: Take a snapshot of the JavaScript heap at a specific moment. This shows all objects in memory, their sizes, and their retained paths. Essential for detecting memory leaks.
- Allocation Instrumentation: Records all memory allocations over time, showing you exactly where memory is being allocated in your code.
- Console & Sources Tabs:
console.profile()/console.time(): Programmatically profile code sections.- Breakpoints and step-through debugging: Allows you to pause execution and inspect the Call Stack, local variables, and global scope.
- Performance Tab: The most critical tool for understanding execution. It allows you to record a timeline of your application’s activity, showing:
Node.js Inspector:
- Node.js ships with its own inspector, compatible with Chrome DevTools. You can run Node.js with
node --inspect index.jsand connect to it from Chrome’schrome://inspectpage. - Provides all the same performance, memory, and debugging capabilities as the browser DevTools, but for server-side JavaScript.
- Node.js ships with its own inspector, compatible with Chrome DevTools. You can run Node.js with
V8 Internal Flags (for Node.js):
- As mentioned in Advanced Topics, V8 offers flags for deep introspection:
node --v8-options: Lists all available V8 flags.node --trace-opt your_script.js: Shows when functions are optimized.node --trace-deopt your_script.js: Shows when optimized functions are deoptimized.node --print-bytecode your_script.js: Dumps the bytecode for functions.node --print-code your_script.js: Dumps the generated machine code (highly technical, but shows the final output).
- These flags are primarily for advanced engine developers or those doing extreme performance tuning, offering a raw look at the JIT’s decisions.
- As mentioned in Advanced Topics, V8 offers flags for deep introspection:
What to Look For:
- Long tasks in Performance profile: Indicate blocking JavaScript execution.
- Frequent “Deoptimize” events: Suggest type instability or problematic code patterns that prevent the JIT from maintaining optimized code.
- Growing heap size in Memory tab: Points to potential memory leaks.
- Excessive GC activity: Frequent, long garbage collection pauses can indicate inefficient memory usage.
- Asynchronous operations blocking the main thread: Look for callbacks that take too long to execute once they hit the Call Stack.
By leveraging these tools, developers can move beyond guesswork and gain empirical data to understand how their JavaScript code interacts with the underlying engine, enabling targeted optimizations and effective debugging.
Key Takeaways
- JavaScript is JIT Compiled: Modern JavaScript engines use a sophisticated Just-In-Time compilation pipeline (Interpreter + Optimizing Compiler) to achieve high performance, not pure interpretation.
- The Pipeline: Code goes from Source -> Tokens -> AST -> Bytecode -> Interpretation (Ignition) -> Profiling -> JIT Compilation (TurboFan) -> Optimized Machine Code.
- Type Feedback is Crucial: The JIT compiler relies heavily on observed type consistency to make aggressive optimizations. Inconsistent types lead to deoptimization.
- Event Loop for Concurrency: JavaScript’s single-threaded nature is managed by the Event Loop, which orchestrates asynchronous tasks, allowing non-blocking I/O and UI updates.
- Sophisticated Memory Management: Generational Garbage Collection minimizes pauses by efficiently reclaiming memory for short-lived objects and performing more thorough collections for long-lived ones.
- Performance is a Partnership: Writing performant JavaScript involves understanding how the engine works and writing code that is “JIT-friendly” (e.g., consistent types, avoiding hidden class changes, not blocking the main thread).
- Tools are Your Friends: Browser DevTools and Node.js Inspector provide powerful capabilities to profile, debug, and inspect engine internals, helping identify and resolve performance bottlenecks.
When this knowledge is useful:
- Optimizing critical code paths: Understanding JIT behavior helps write code that stays optimized.
- Debugging performance issues: Identifying deoptimizations, memory leaks, or Event Loop blocking.
- Architecting complex applications: Making informed decisions about asynchronous patterns, Web Workers, and WebAssembly.
- Understanding language features: Deeper grasp of closures, hoisting, and scope.
References
- V8 Blog - Official Google V8 Engine Blog
- ECMAScript Language Specification
- MDN Web Docs - JavaScript Engine
- JavaScript Visualized: Event Loop - Philip Roberts (JSConf EU)
- A tour of V8: full compilation pipeline - V8 Blog
- Garbage collection in JavaScript - MDN Web Docs
- Hidden classes and inline caches in V8 - V8 Blog
Transparency Note
This guide was created by an AI expert to provide a detailed, technical explanation of how JavaScript code is compiled and executed, incorporating information and concepts current as of 2026. While significant effort was made to ensure accuracy and depth, the field of JavaScript engine development is constantly evolving. For the most up-to-date and granular details, consulting official engine documentation and source code is always recommended.